How is the market? It’s a question our agents get asked a lot, and for good reason. If you’re considering buying a new home or selling one that you already own, the market trends and predictions are important in the decision-making process. Below is our most recent market update information for Davidson, Maury, Rutherford, Sumner, Williamson, Wilson, Bedford, and Coffee counties to help you make the most informed and beneficial choices possible.
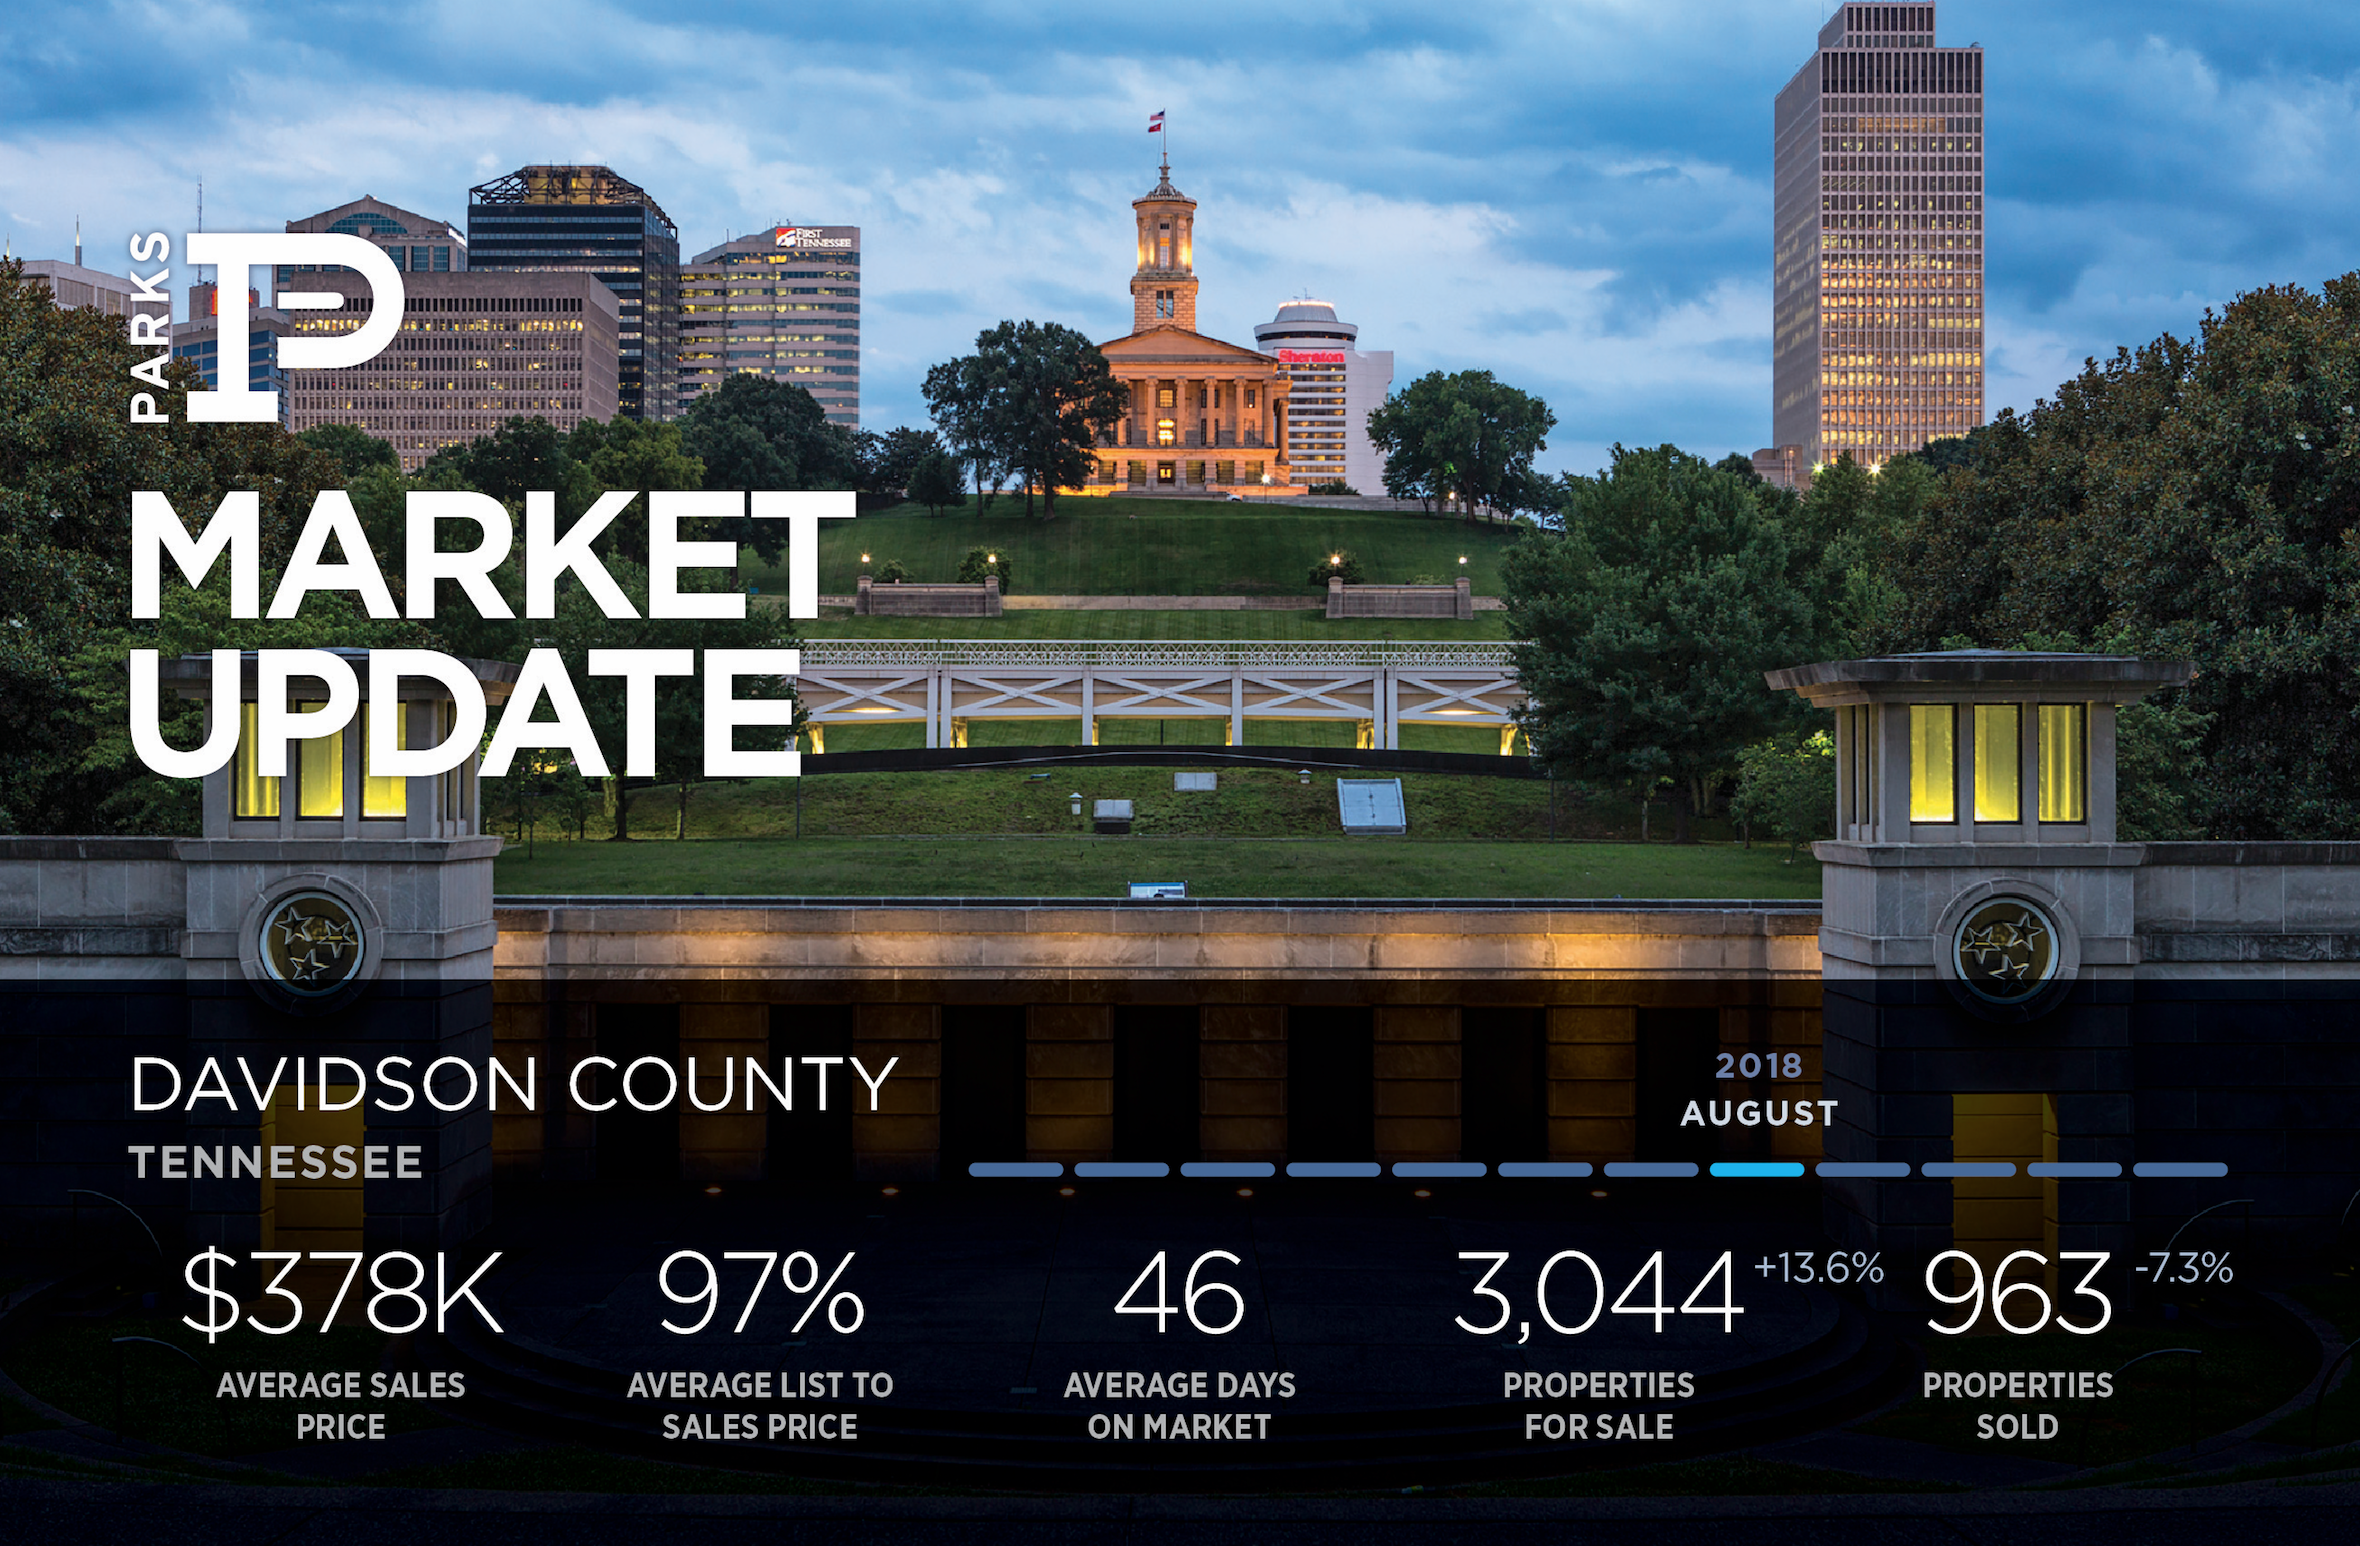
Davidson County Market Update
Homes for Sale
• Up 5% Compared to the Last Month
• Up 13.6% Compared to the Last Year
Homes Closed
• Down 2.1% Compared to the Last Month
• Down 7.3% Compared to the Last Year
Homes Placed Under Contract
• Up 6.6% Compared to the Last Month
• Up 2.4% Compared to the Last Year
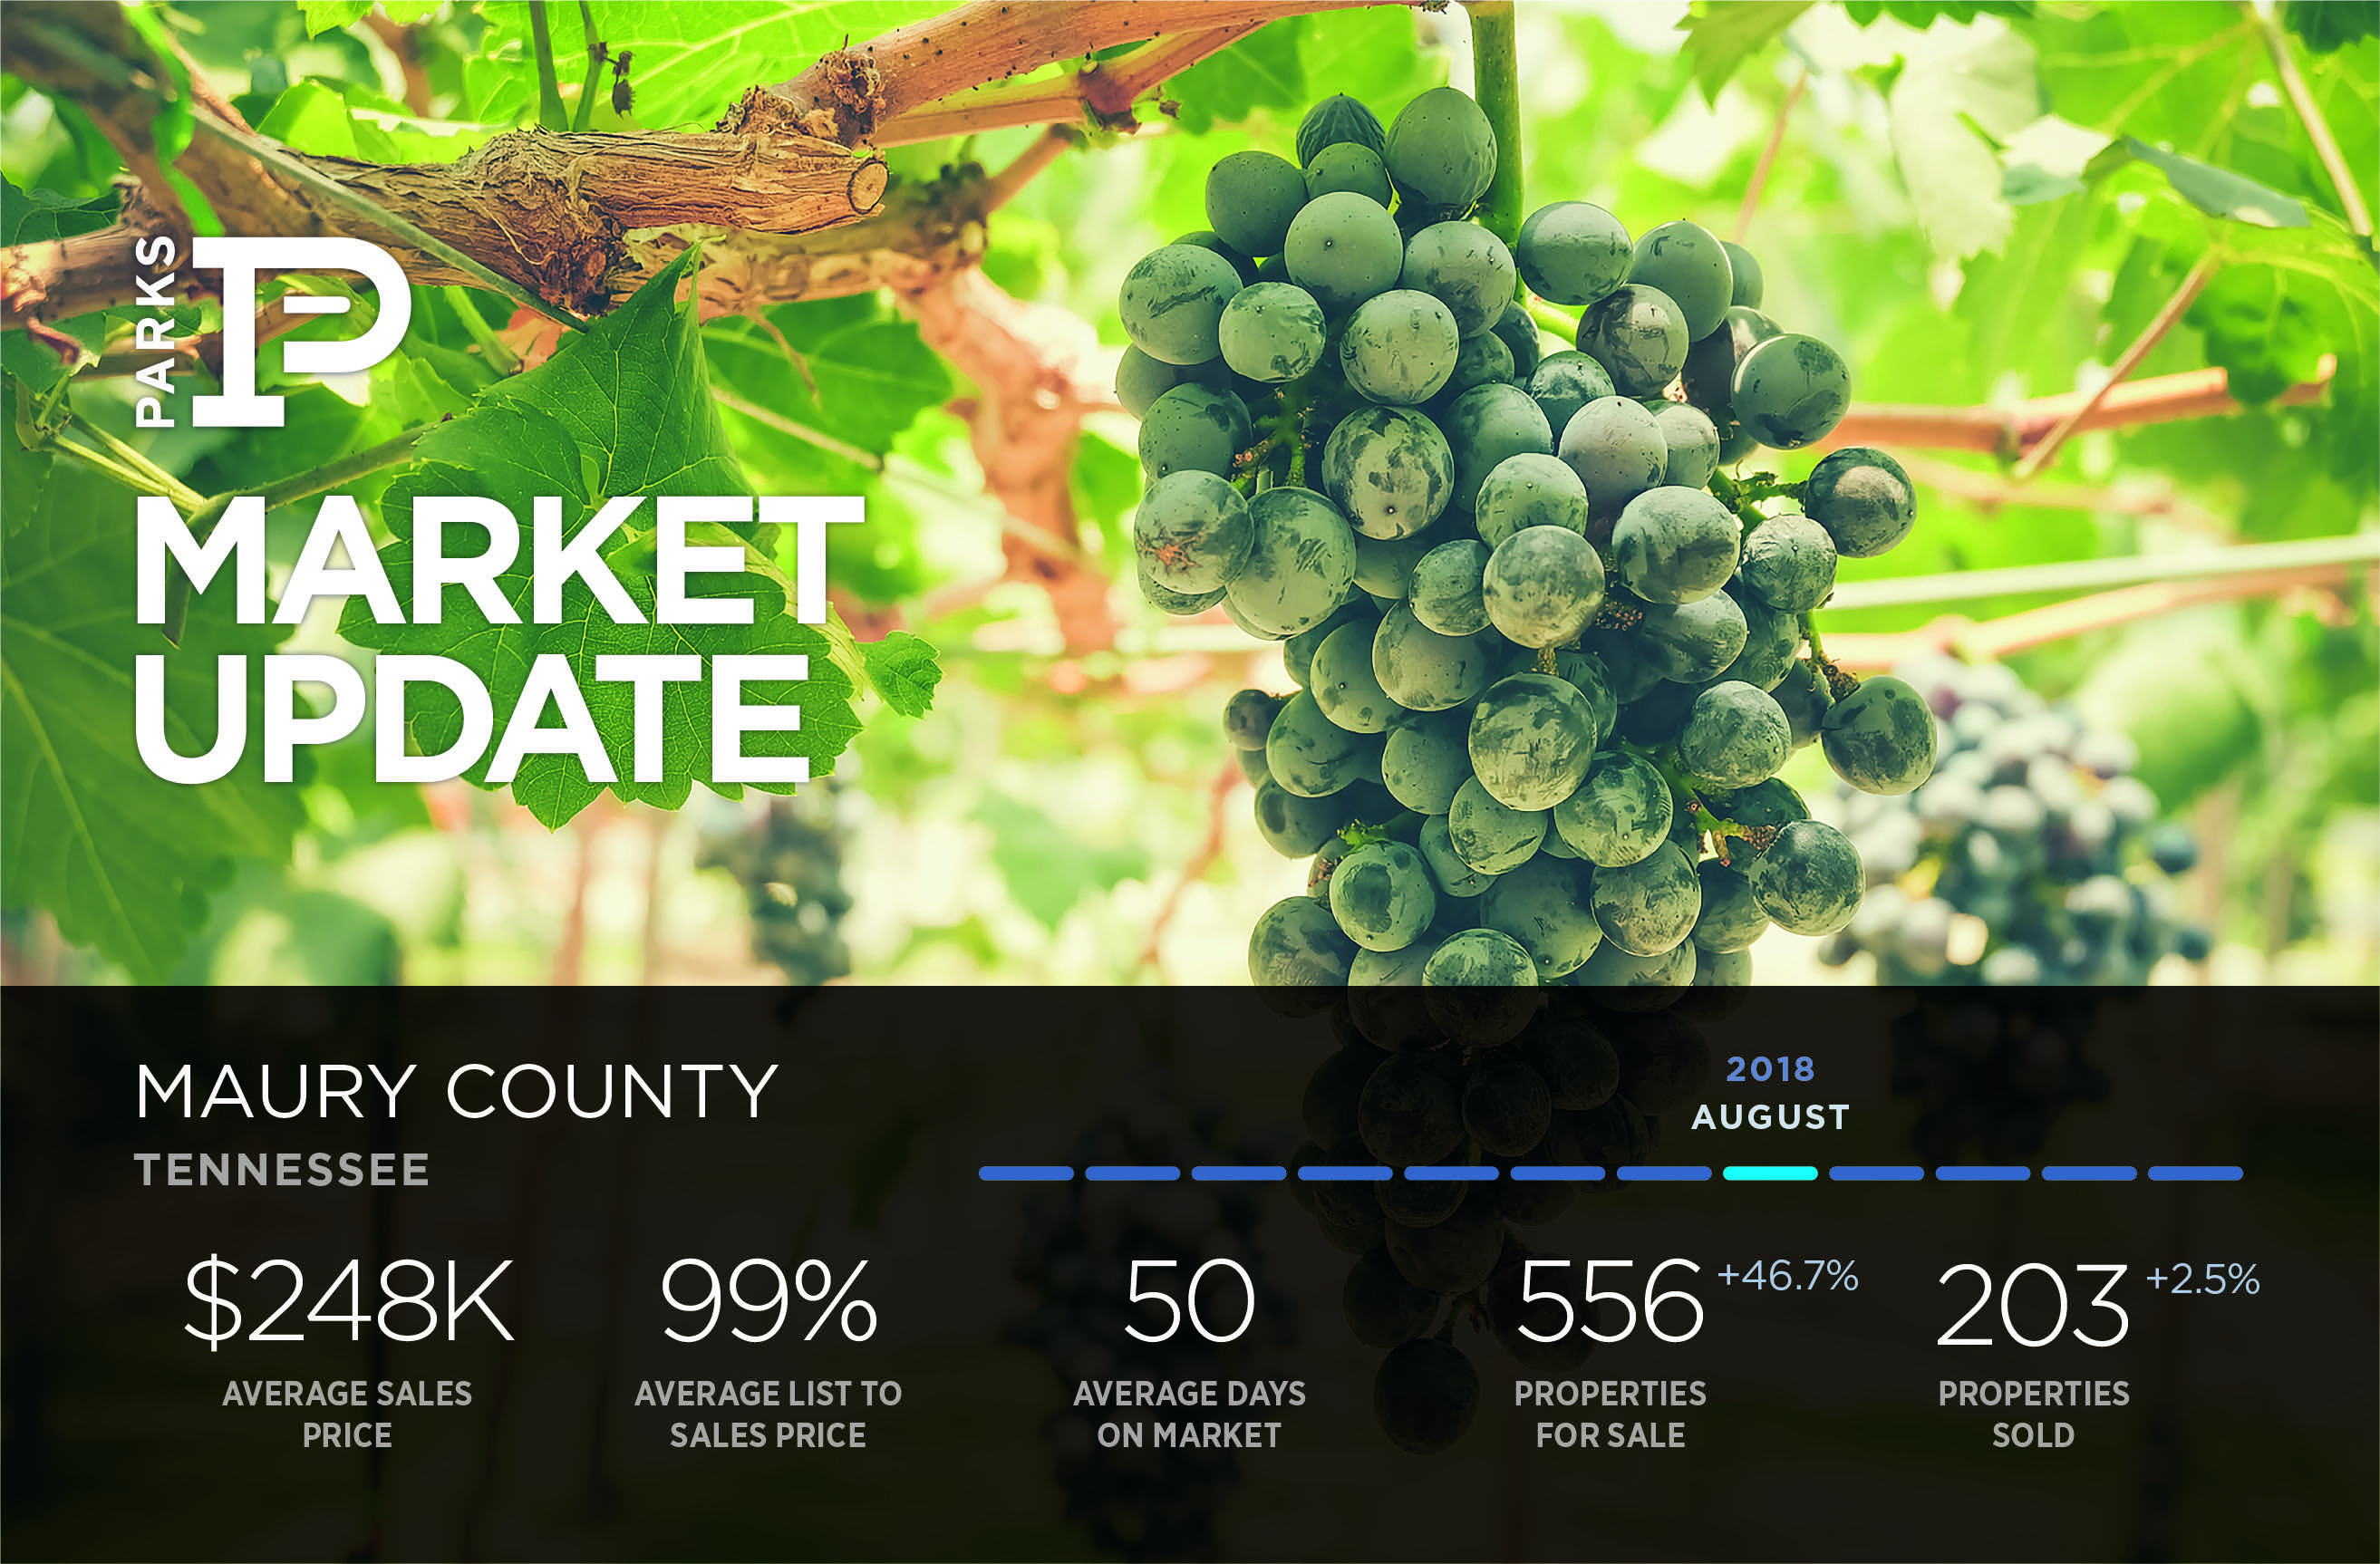
Maury County Market Update
Homes for Sale
• Up 9.9% Compared to the Last Month
• Up 46.7% Compared to the Last Year
Homes Closed
• Up 3% Compared to the Last Month
• Up 2.5% Compared to the Last Year
Homes Placed Under Contract
• Up 2% Compared to the Last Month
• Down 17.3% Compared to the Last Year
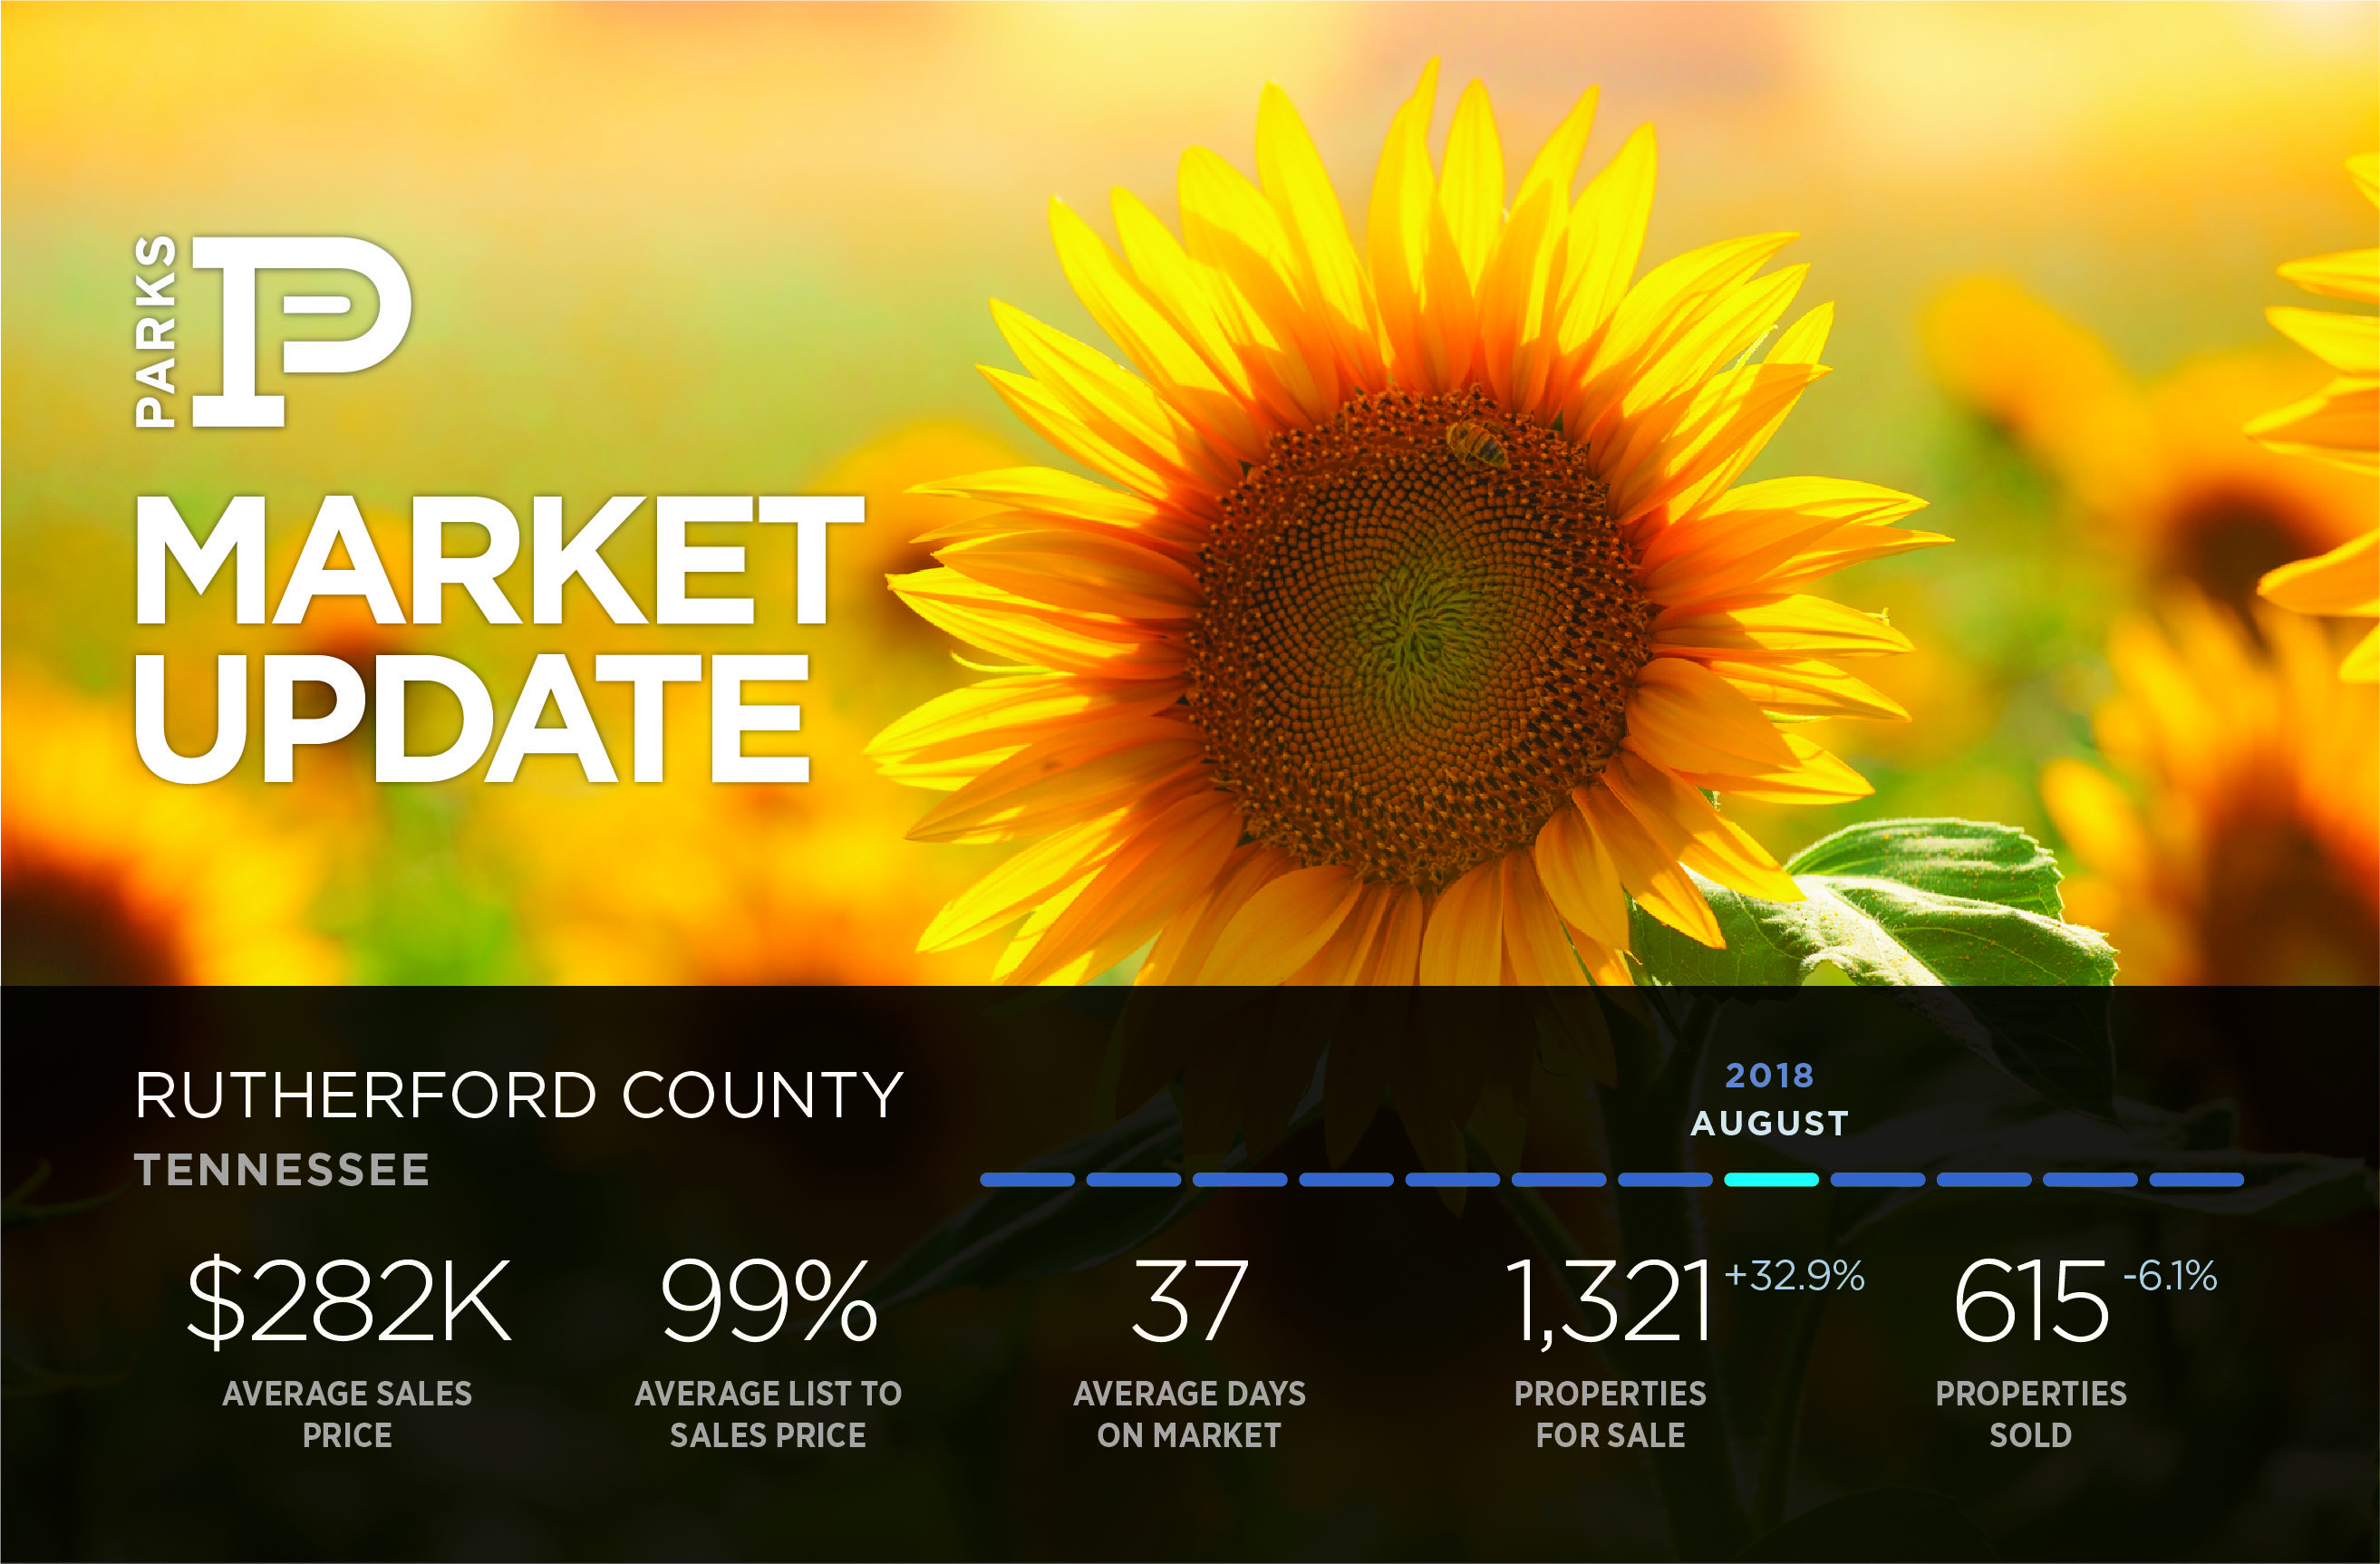
Rutherford County Market Update
Homes for Sale
• Up 5.3% Compared to the Last Month
• Up 32.9% Compared to the Last Year
Homes Closed
• Up 2.2% Compared to the Last Month
• Down 6.1% Compared to the Last Year
Homes Placed Under Contract
• Up 7.7% Compared to the Last Month
• Up 0.1% Compared to the Last Year

Sumner County Market Update
Homes for Sale
• Up 6.3% Compared to the Last Month
• Up 36.2% Compared to the Last Year
Homes Closed
• Up 3.2% Compared to the Last Month
• Down 0.3% Compared to the Last Year
Homes Placed Under Contract
• Down 6.6% Compared to the Last Month
• Down 2.1% Compared to the Last Year
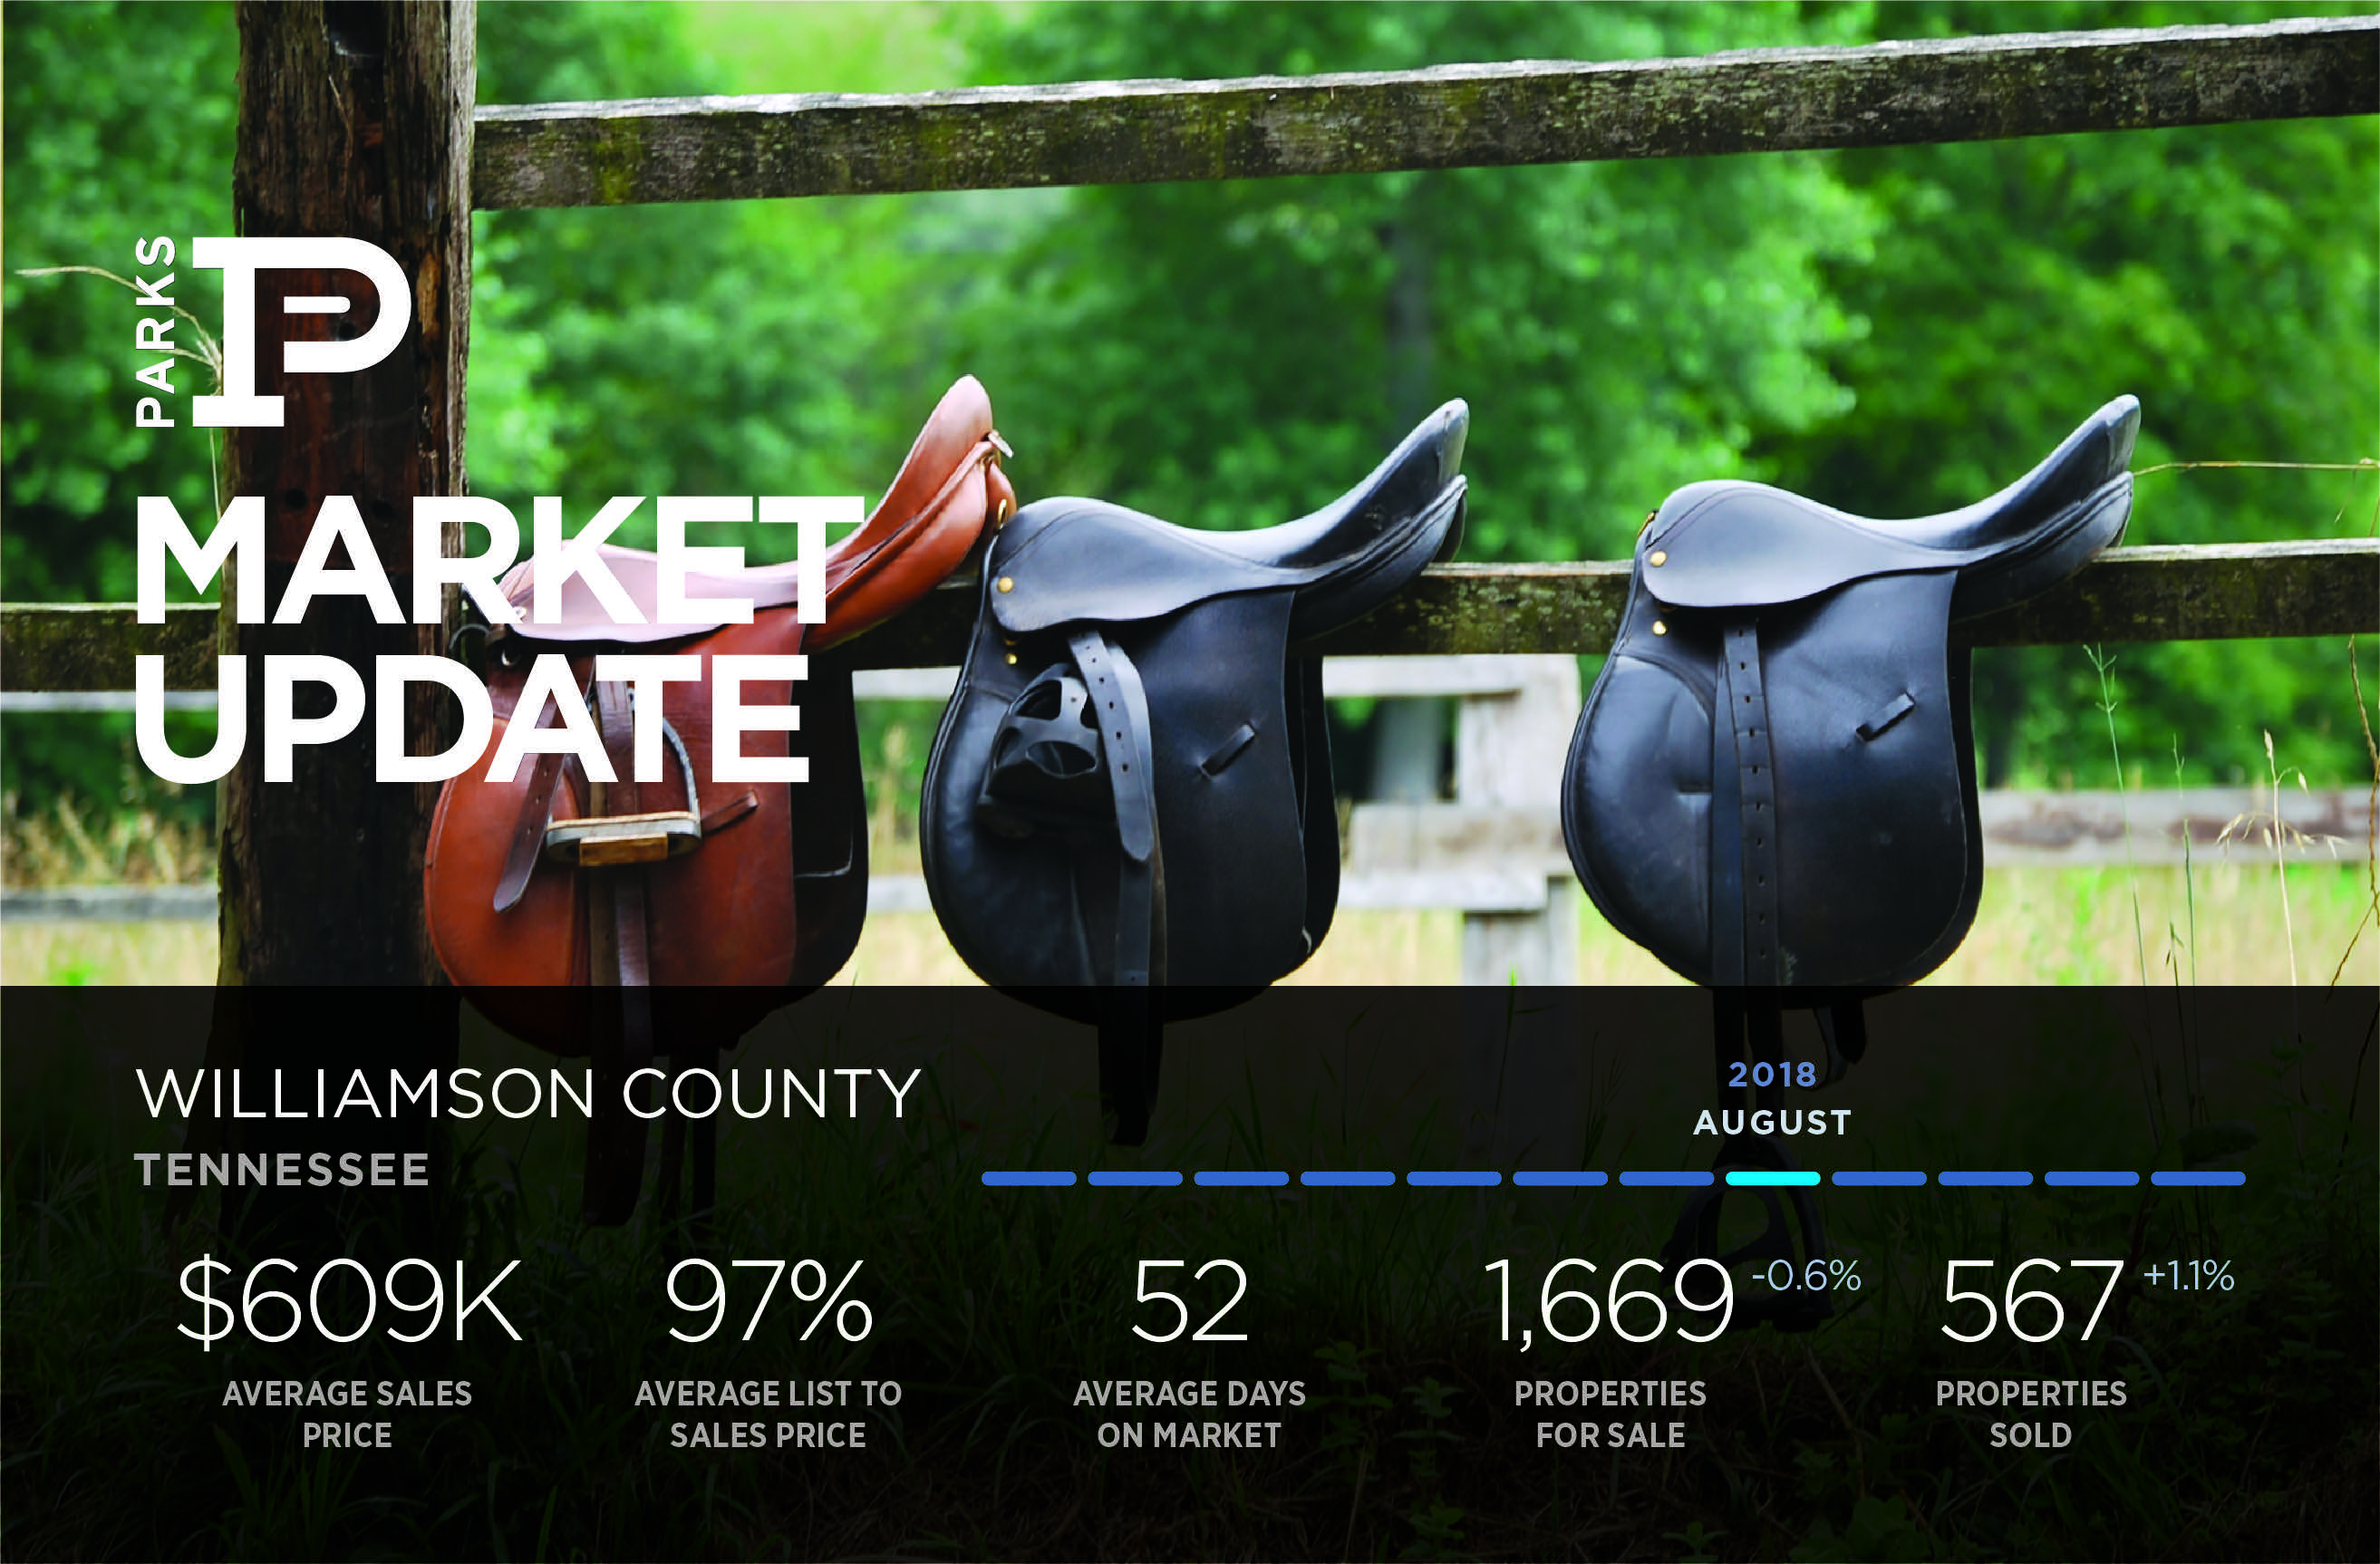
Williamson County Market Update
Homes for Sale
• Down 5.2% Compared to the Last Month
• Down 0.6% Compared to the Last Year
Homes Closed
• Down 4.1% Compared to the Last Month
• Up 1.1% Compared to the Last Year
Homes Placed Under Contract
• Down 7.2% Compared to the Last Month
• Down 10.9% Compared to the Last Year
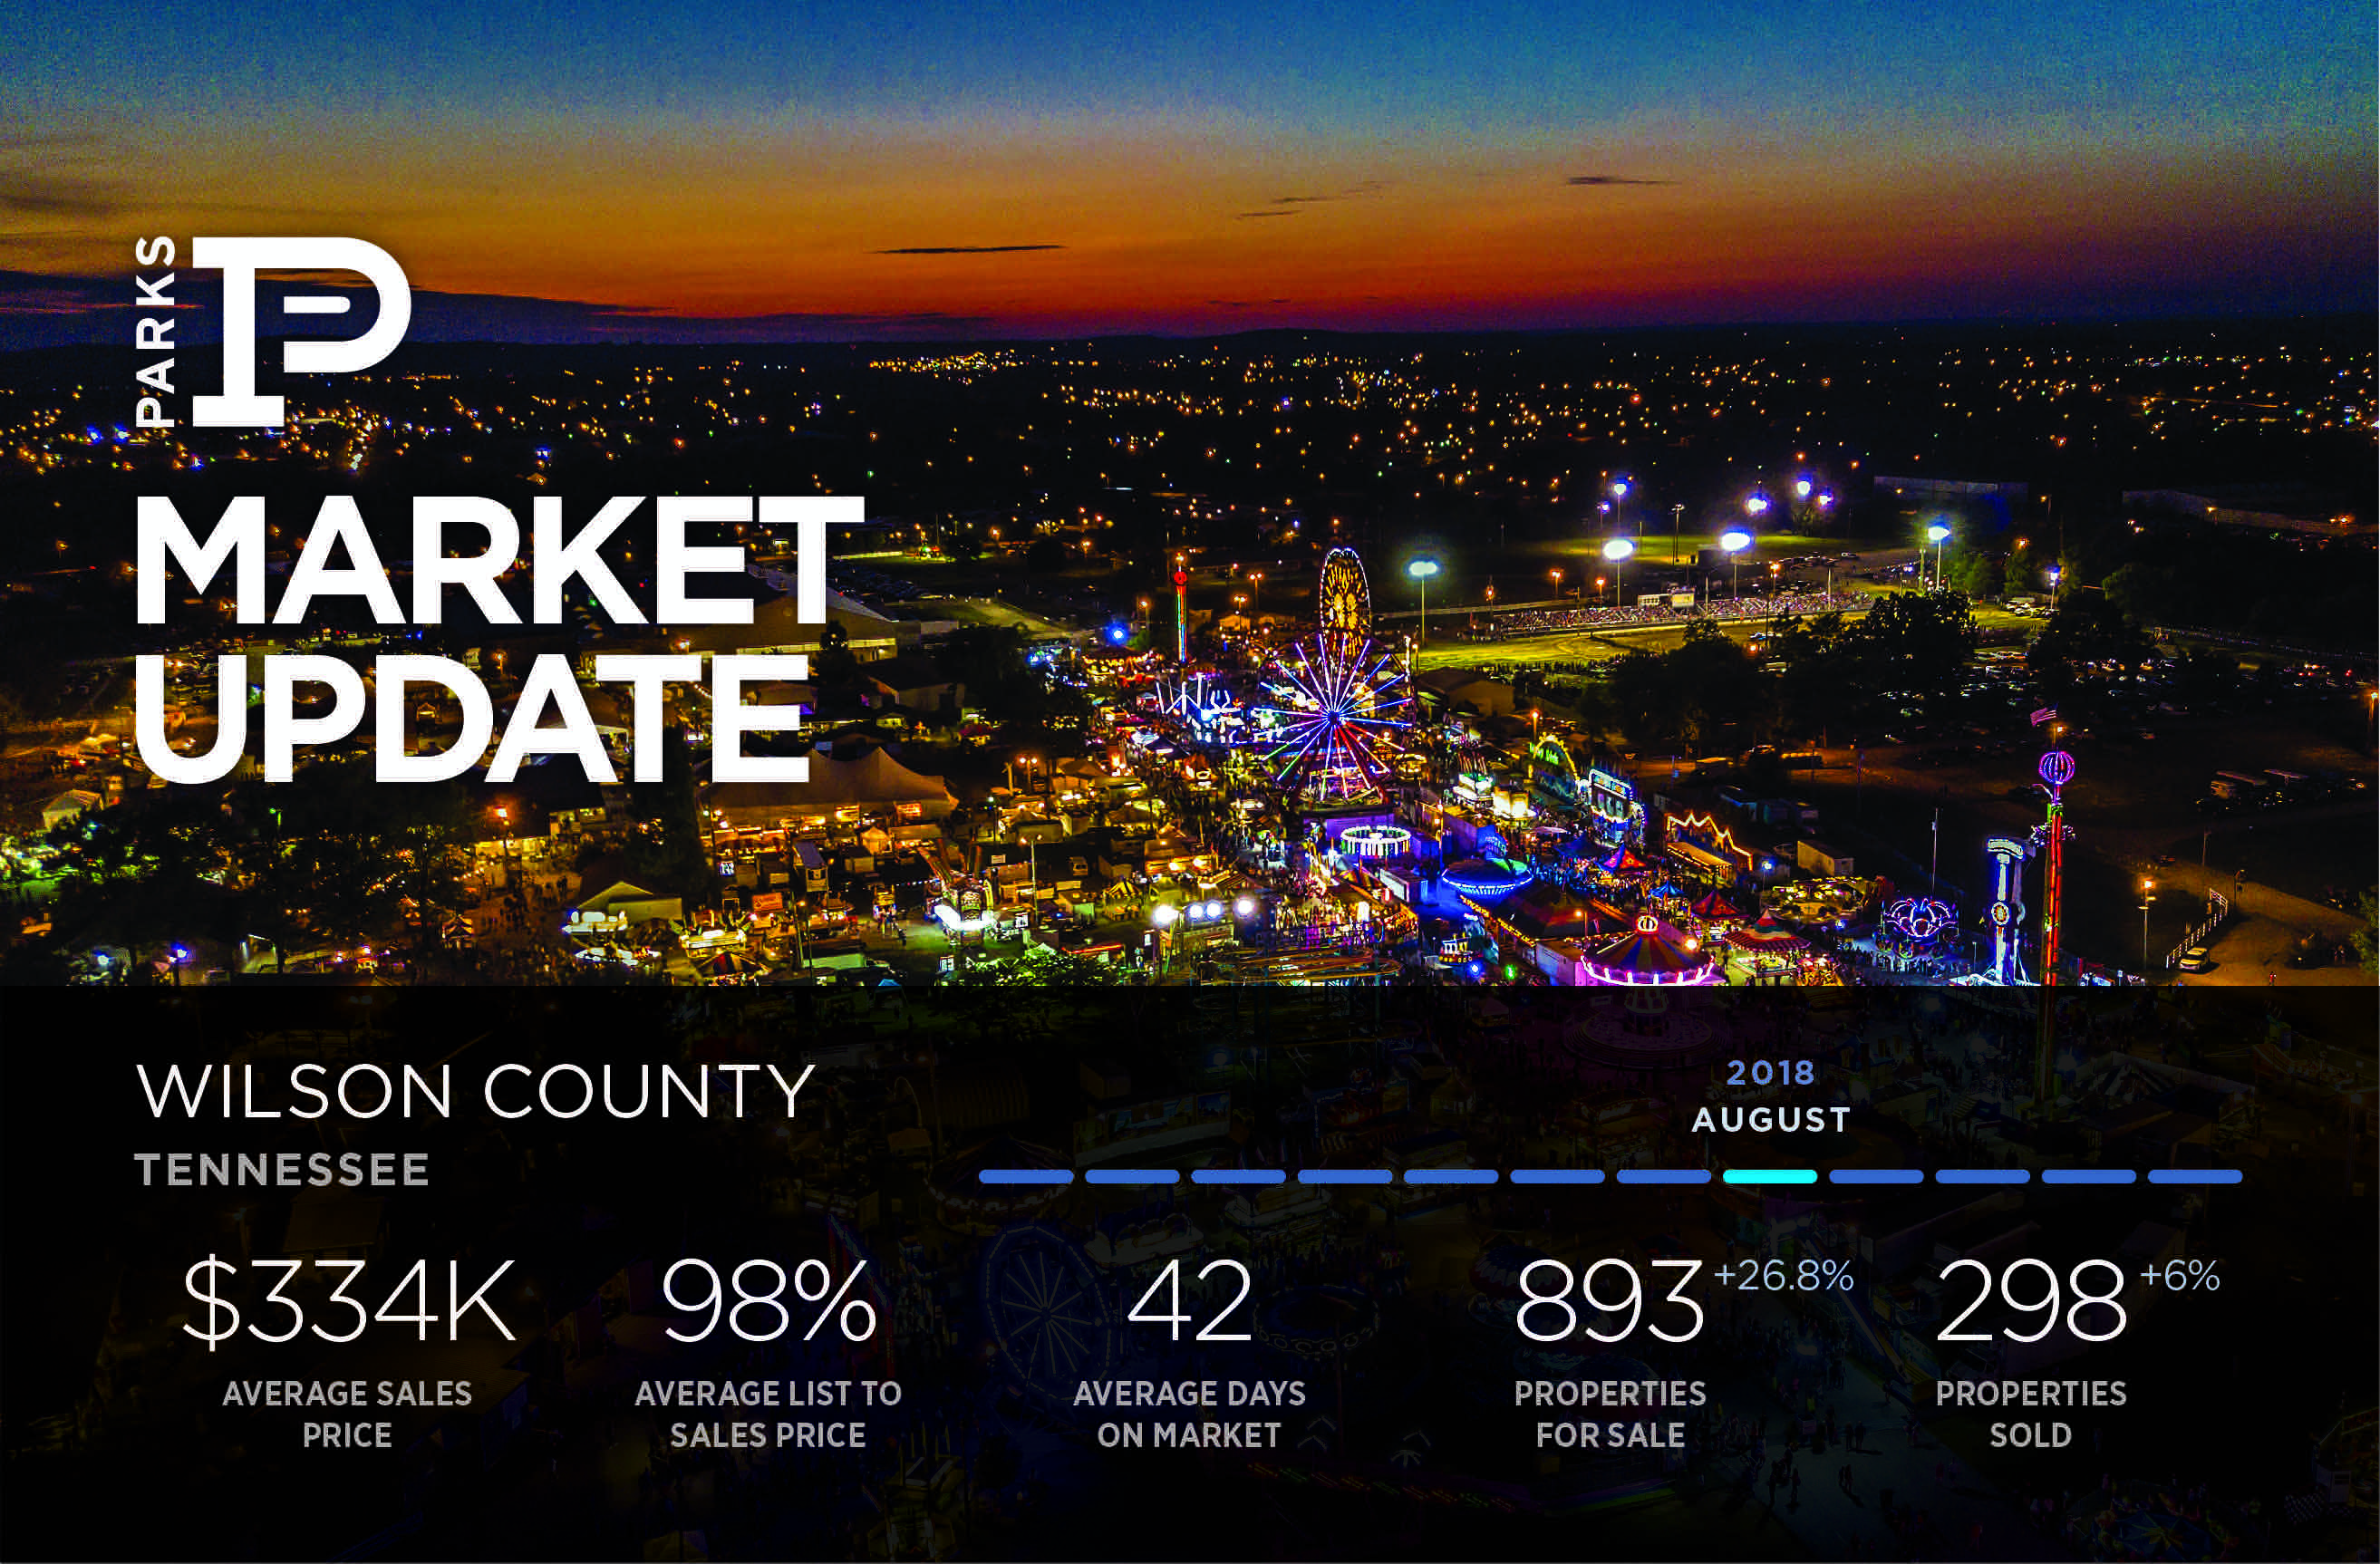
Wilson County Market Update
Homes for Sale
• Up 9.3% Compared to the Last Month
• Up 26.8% Compared to the Last Year
Homes Closed
• Up 1% Compared to the Last Month
• Up 6% Compared to the Last Year
Homes Placed Under Contract
• Up 10% Compared to the Last Month
• Down 3.5% Compared to the Last Year
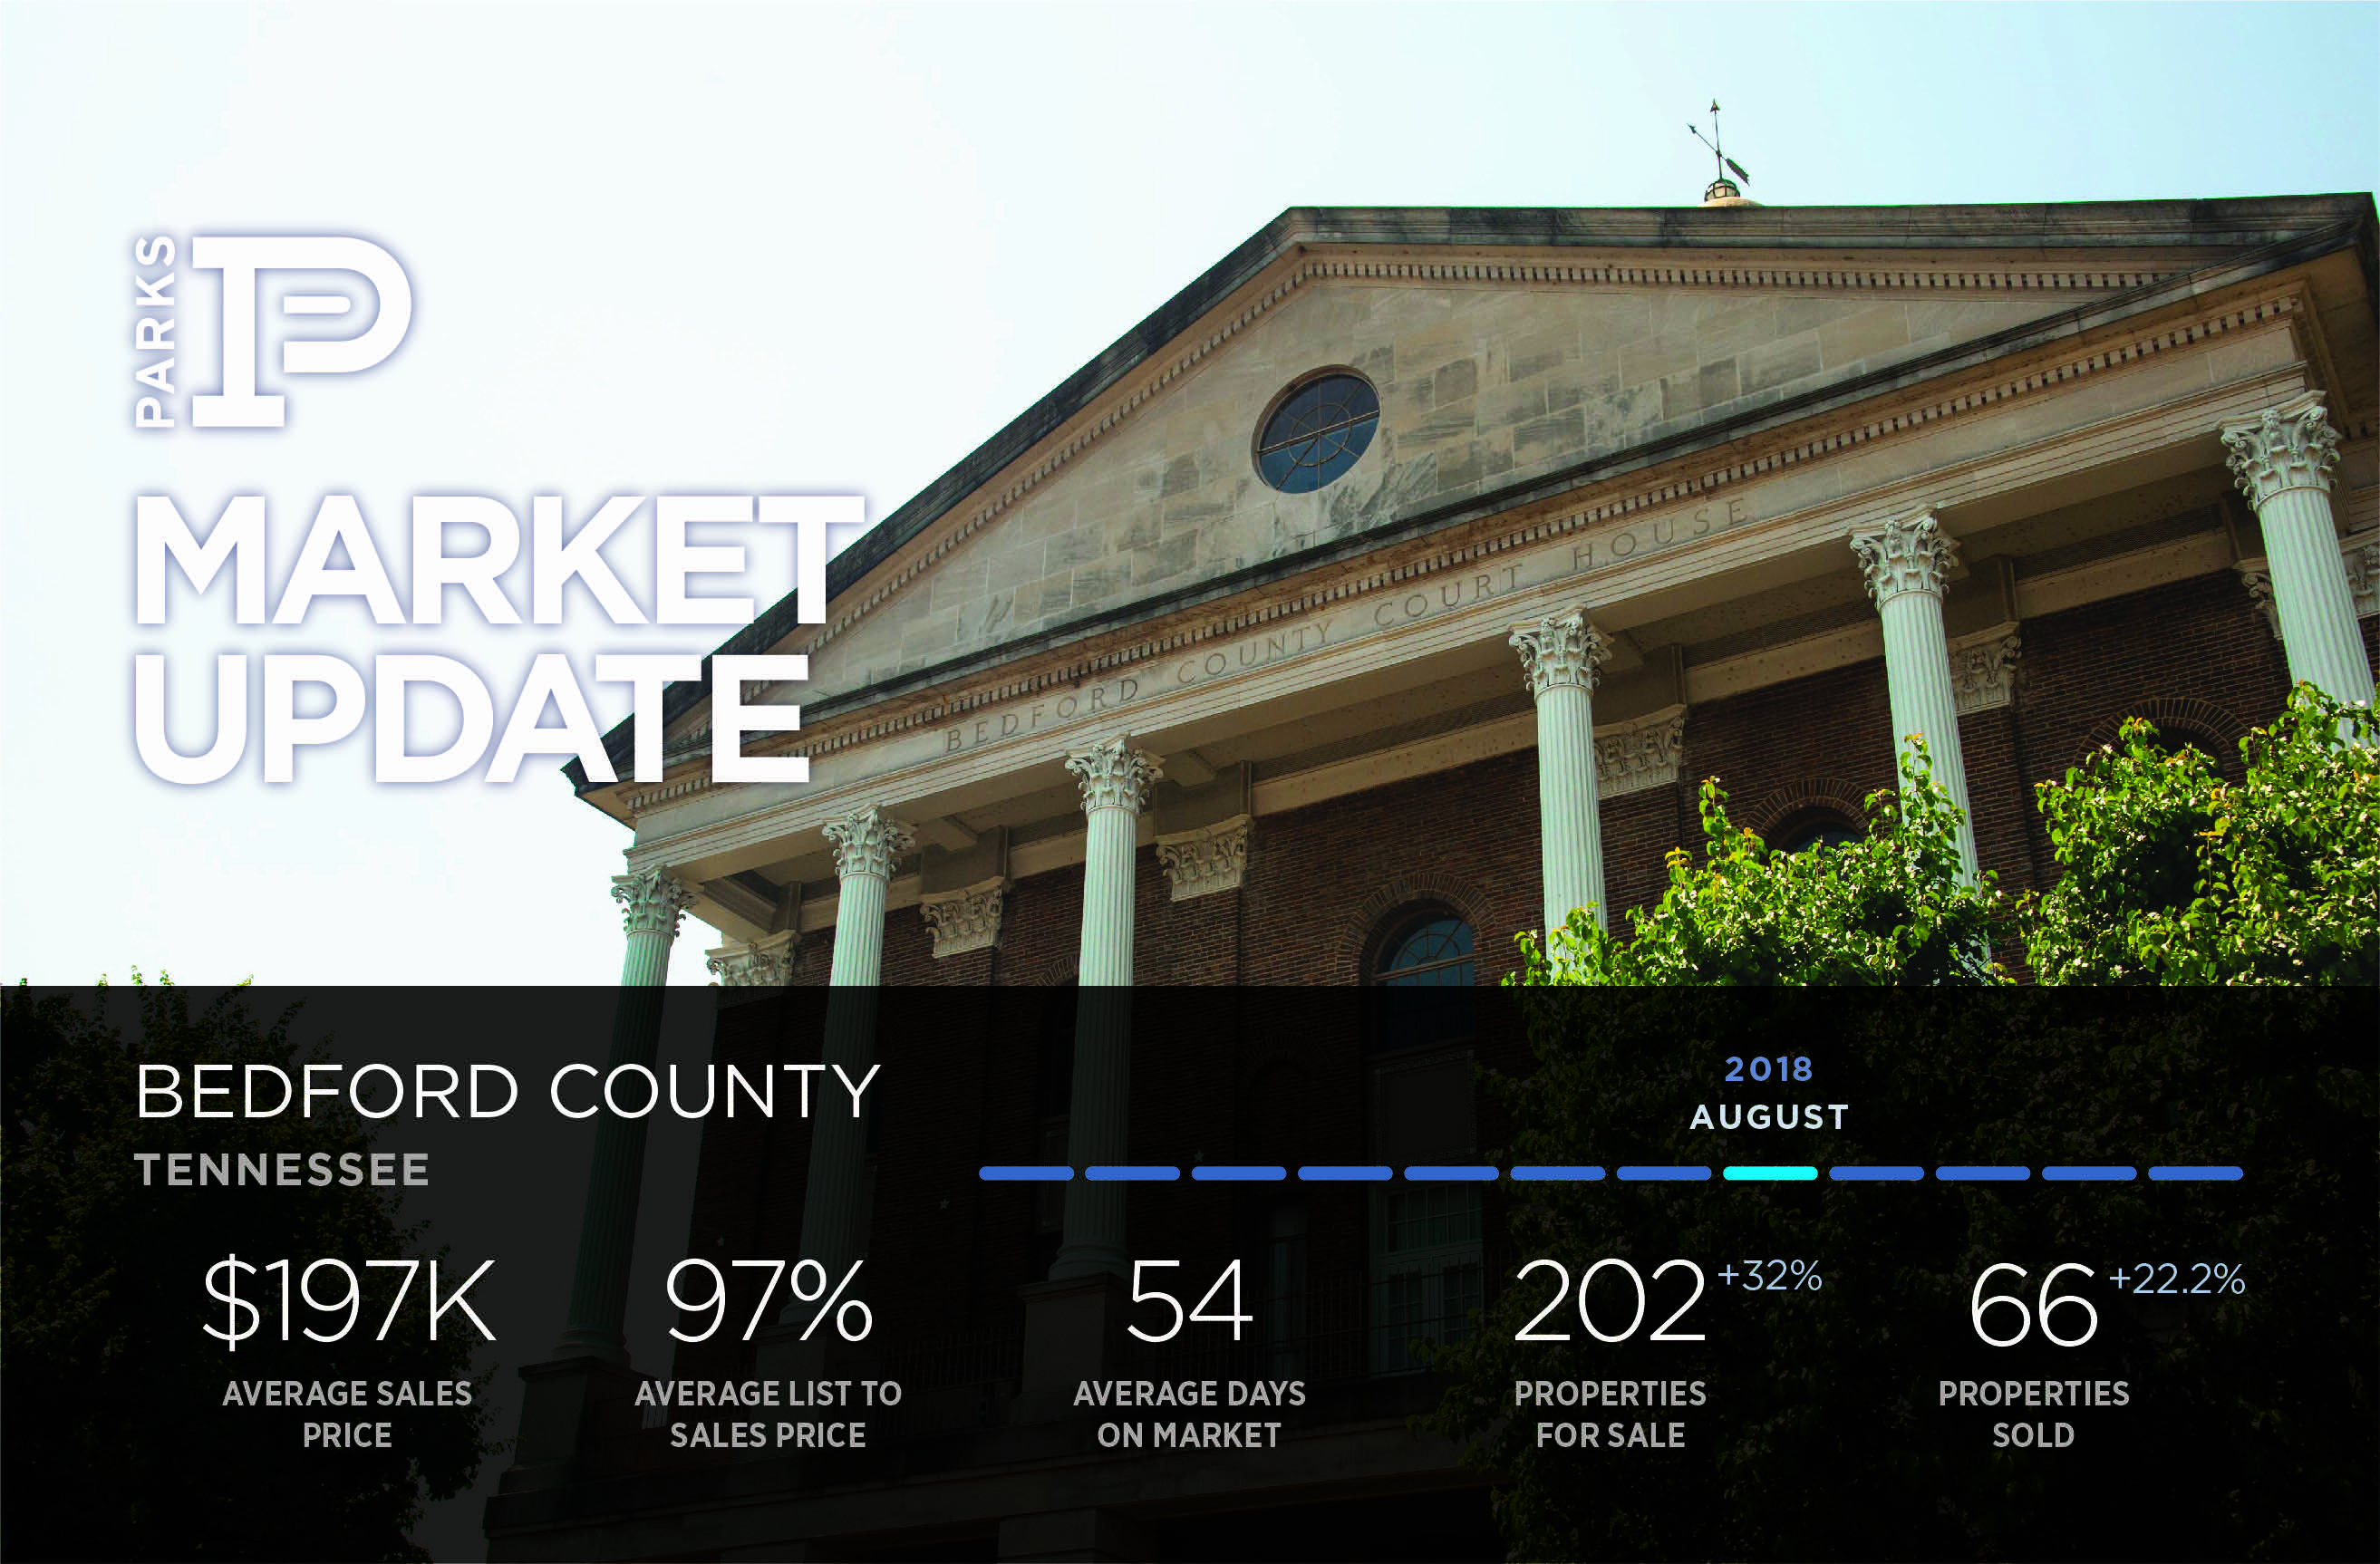
Bedford County Market Update
Homes for Sale
• Up 1% Compared to the Last Month
• Up 32% Compared to the Last Year
Homes Closed
• Up 4.8% Compared to the Last Month
• Up 22.2% Compared to the Last Year
Homes Placed Under Contract
• Up 40.4% Compared to the Last Month
• Up 28.1% Compared to the Last Year
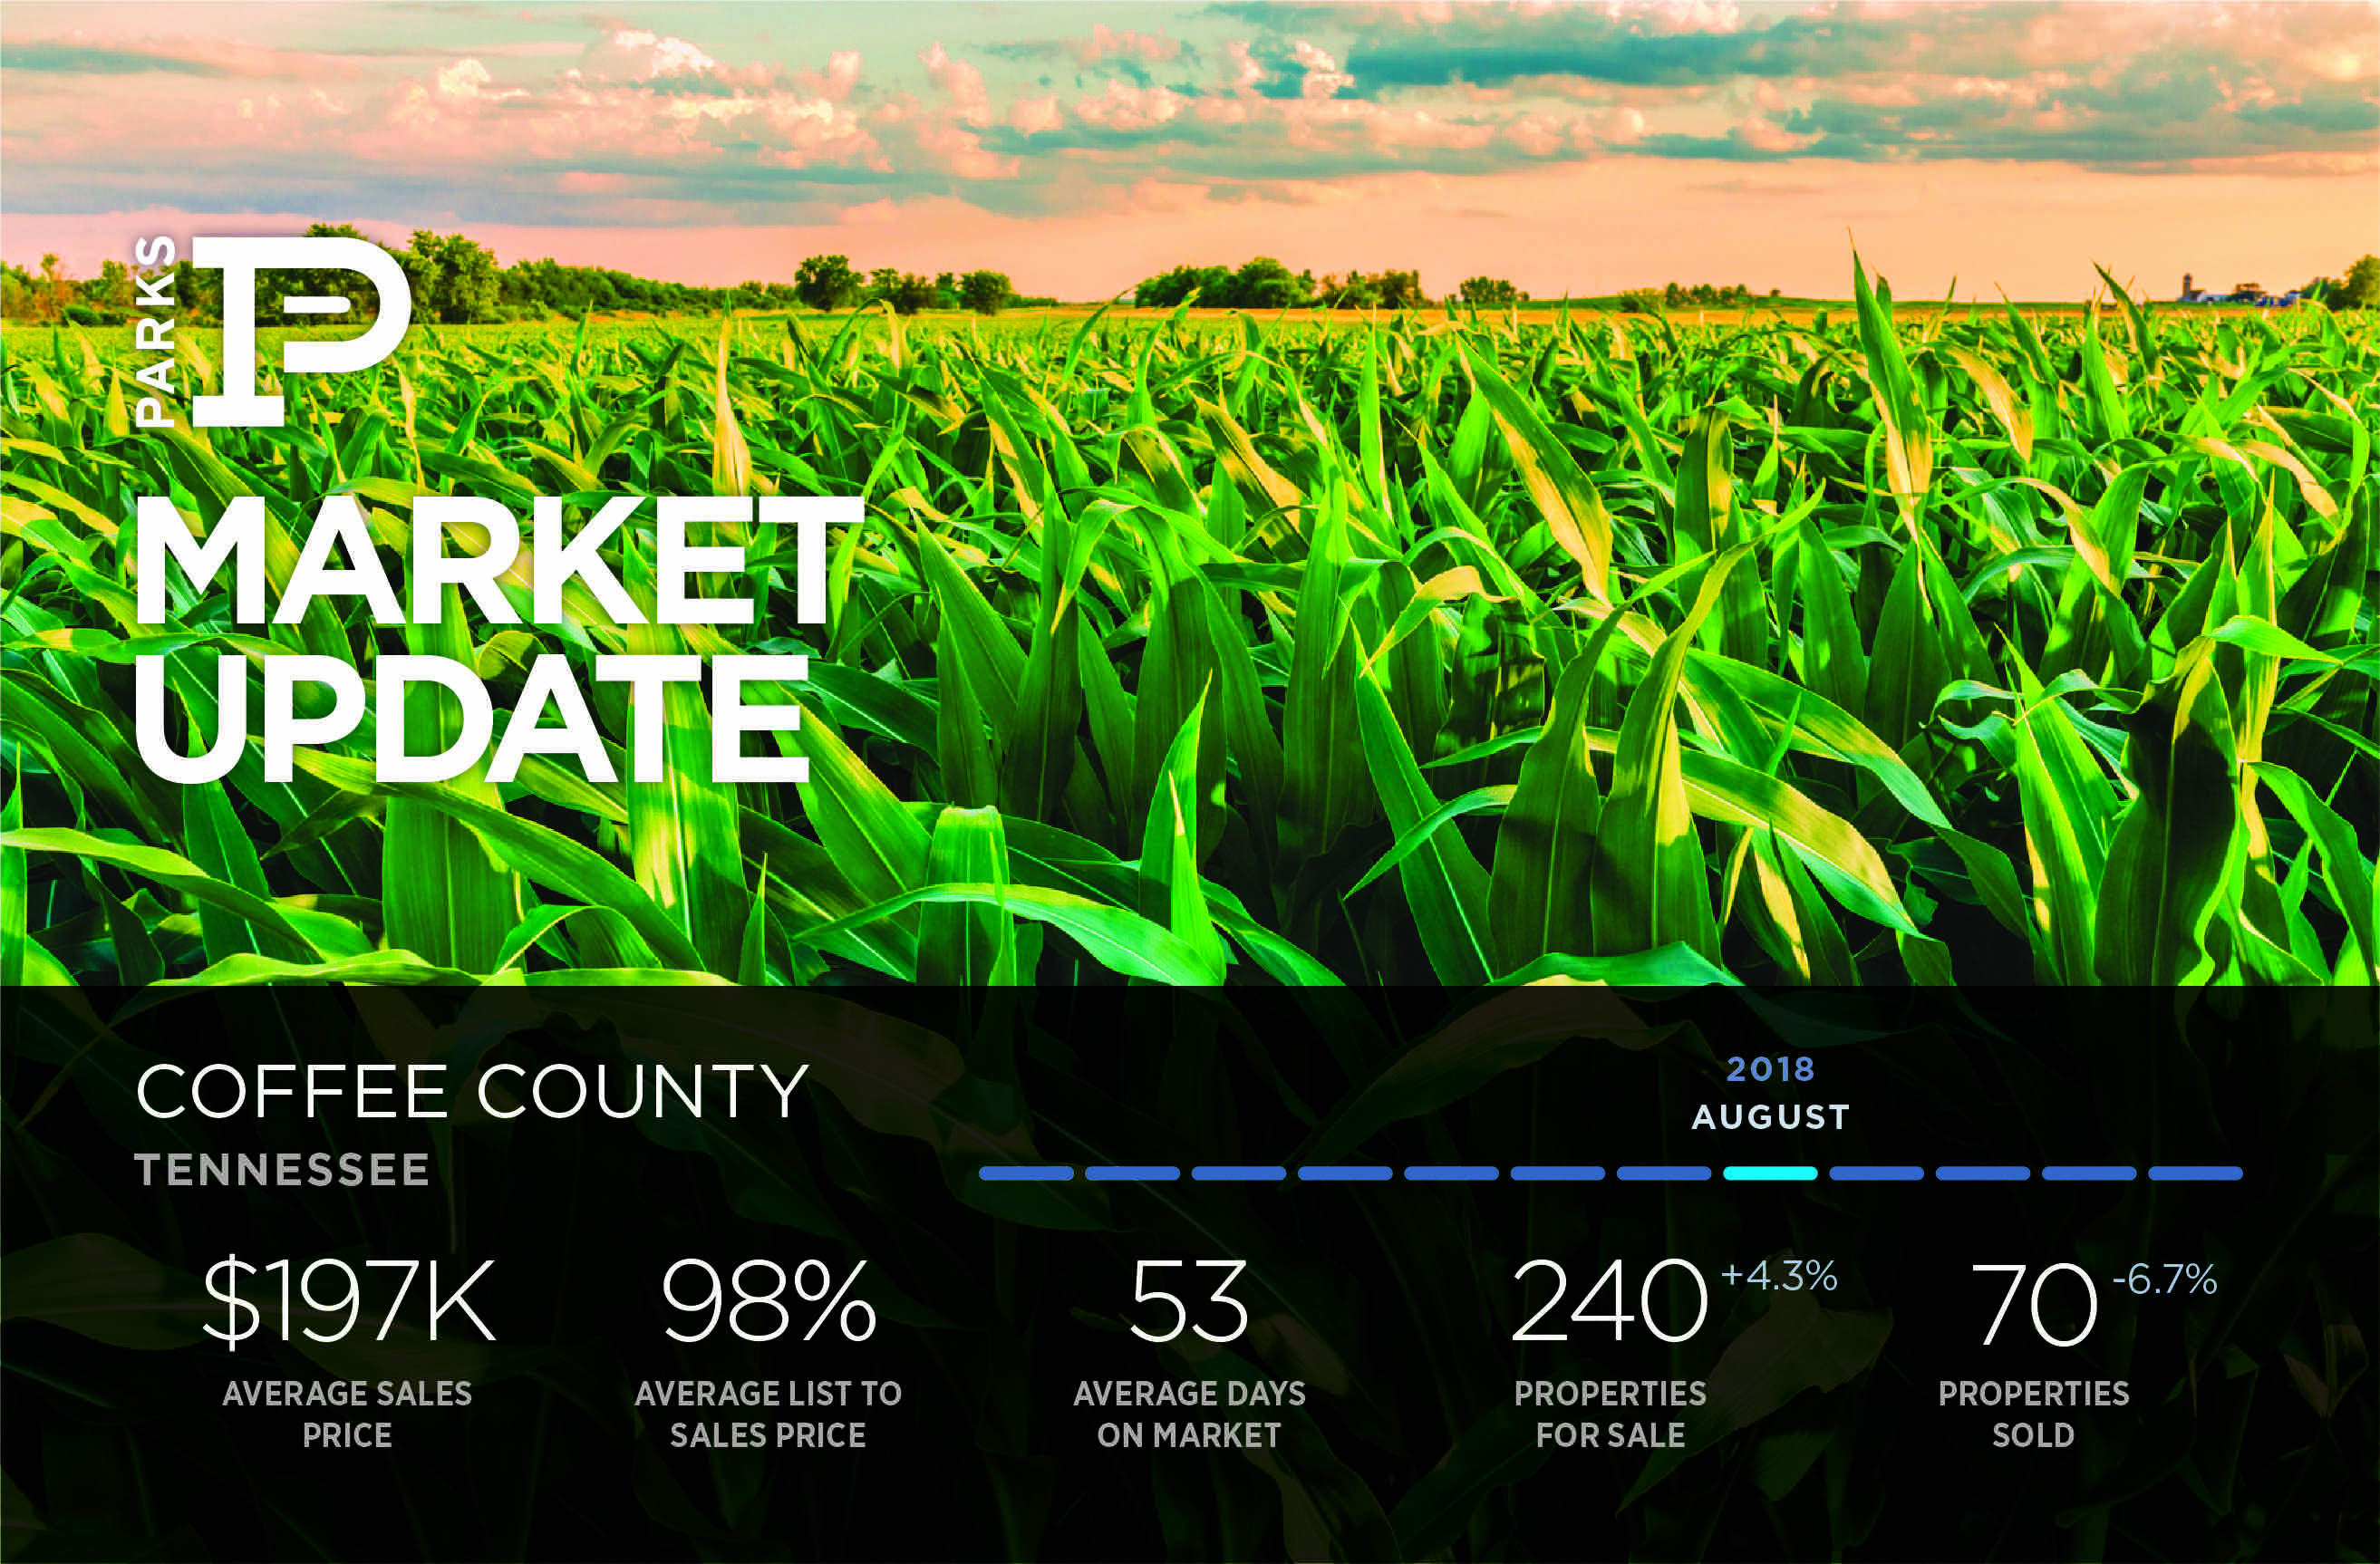
Coffee County Market Update
Homes for Sale
• Up 1.3% Compared to the Last Month
• Up 4.3% Compared to the Last Year
Homes Closed
• Down 13.6% Compared to the Last Month
• Down 6.7% Compared to the Last Year
Homes Placed Under Contract
• Up 28.4% Compared to the Last Month
• Up 8% Compared to the Last Year
See the Previous Month’s Stats!
Posted by Parks Compass on
Leave A Comment